
Data Analytics
When two departments bring different revenue figures to the same meeting, the problem is seldom the chart. One counted refunds and the other did not. One used invoice date and the other payment date.
Our analytics work starts by settling those definitions in writing, then builds the plumbing that applies them the same way every day. The dashboards come last and are the easy part.
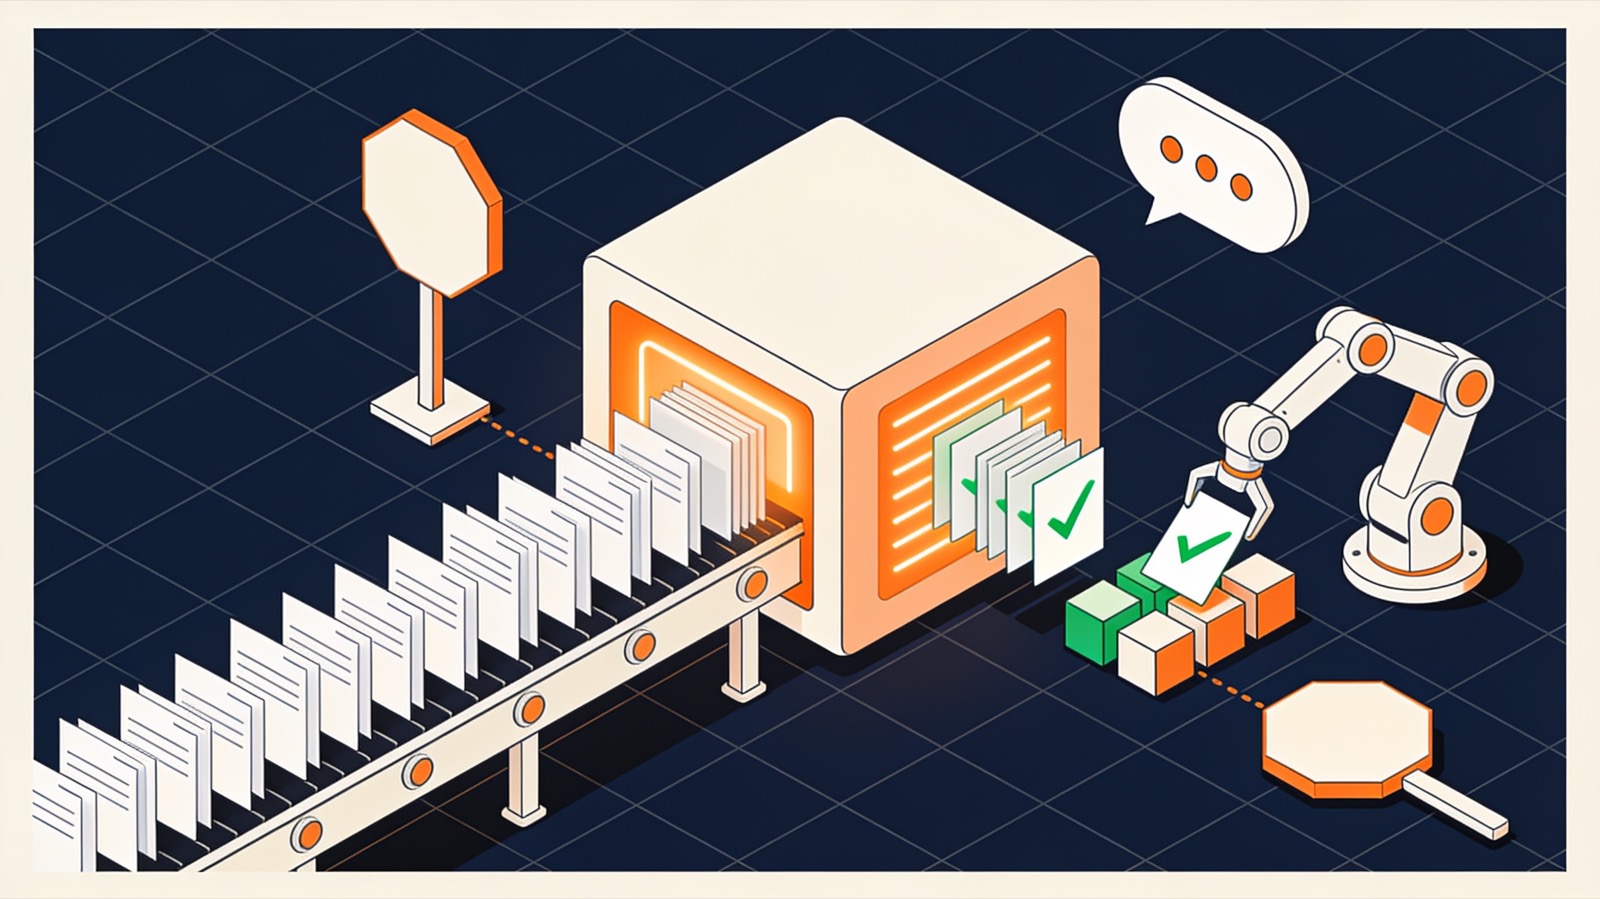
What sits between a source system and a chart
Four layers. Skipping one is how reports come to disagree.
Extraction
Scheduled jobs copy data from the accounting package, shop, CRM, ad platforms and spreadsheets. Each run is logged, and a failed run raises an alert instead of leaving yesterday's numbers on screen.
Warehouse
A single database holds the raw copies, untouched. If a calculation is later found to be wrong, it can be rerun from the originals.
Transformation
SQL models, kept in version control, turn raw tables into clean ones: one row per order, per customer, per day. Tests check for duplicates and nulls on every run.
Presentation
Dashboards and scheduled emails read only from the clean tables. No formula lives inside a chart.
One meaning per metric
Each metric gets a short entry in a shared glossary. Examples of what has to be decided:
Revenue
Gross or net of tax, discounts and refunds. Recognised on order, dispatch, invoice or payment. In which currency, at which exchange rate.
Active customer
Bought within the last ninety days, logged in this month, or holds a contract that has not lapsed. Pick one and name the others differently.
Conversion
Orders divided by visits, by visitors, or by sessions that reached the product page. The denominator changes the answer several times over.
Lead time
Measured from order, from payment or from stock allocation, in calendar days or working days.
Reporting day
Where the day begins and ends, and in which time zone. A shop selling across continents can shift a whole evening of orders into the wrong date.
Owner
Every definition has a named person who may change it. Changes are dated, and past figures are either restated or marked.
Tools we are comfortable with
A small company rarely needs more than PostgreSQL and one BI tool. We size the setup to the data, not the other way round.
- Warehouse
- PostgreSQLBigQuerySnowflakeClickHouse
- Transformation
- dbtSQL
- Orchestration
- AirflowDagstercron
- Extraction
- AirbyteCustom Python connectors
- Dashboards
- MetabaseApache SupersetPower BILooker Studio
Order of work
Useful output appears early because sources are added one by one.
Discovery
We list the reports in use, the questions they fail to answer, and the systems holding the data.
Glossary
Definitions are drafted, argued over and signed off by their owners.
First source, first dashboard
Usually sales. Totals are reconciled against the source system to the last unit before anyone relies on them.
Further sources
Added in order of value. Joining them is where customer and product identifiers have to be matched.
Hand-over
Your analyst learns to add a metric without us.
Handed over with the dashboards
So that the system outlives the project.
- The metric glossary, with owners
- All transformation code in your repository
- A diagram of sources, tables and refresh times
- Automated data tests and their alert settings
- Access roles: who can see salaries, who cannot
- A reconciliation note for each key figure
- Instructions for adding a new source
- Monthly running cost of the warehouse and tools
What analytics work costs
Our rates are published. Pick the role and move the sliders for an indicative budget.
Rate card
| Role | Hourly | Monthly* |
|---|---|---|
| Frontend / WordPress | AED 110 | AED 17,600 |
| Backend / API | AED 118 | AED 18,880 |
| Full-stack | AED 129 | AED 20,640 |
| Mobile (React Native / Flutter) | AED 129 | AED 20,640 |
| DevOps / Cloud | AED 147 | AED 23,520 |
| AI / Automation engineer | AED 165 | AED 26,400 |
| QA / Test engineer | AED 92 | AED 14,720 |
| UI / UX design | AED 103 | AED 16,480 |
*160 hrs/month full-time. Rates are indicative for planning, in UAE dirhams (converted from our US-dollar rates at the fixed peg of 3.6725), before VAT where applicable, and depend on seniority, contract length and timezone overlap. Longer engagements and multi-role teams are discounted — ask.
Points raised in first calls
We already have dashboards. Why are they not trusted?
Commonly because the logic sits inside each chart and differs between them. Moving calculations into tested warehouse tables fixes that without replacing the BI tool.
Do we need a cloud warehouse?
Not always. Below a few hundred million rows, a well-indexed PostgreSQL server is sufficient and cheaper to understand.
How fresh will the numbers be?
Most management reports are fine with a nightly refresh. Hourly is straightforward. Live figures cost more and are worth it for operations screens only.
How is personal data handled?
Fields are classified during discovery. Names and contact details are masked or left out of tables that analysts query, and access is by role. We build to what your legal or compliance adviser specifies.
Can you work with our spreadsheets?
Yes. Spreadsheets are a legitimate source when they have a fixed layout and an owner. We load them like any other system.
Show us the report nobody believes
Tell us which figure is argued about and which systems feed it. We will come back to you within one business day.